If you make or import souvenirs, gifts or accessories, there’s really only one question worth asking an agent: will you get my range in front of the right buyers?
I’ve been in Australian tourism retail since 1979, so I know the stores I call on pretty well. But I wanted to put some hard numbers behind what I see on the road, so we went through my client list and lined it up against the official tourism figures. Here’s what came out of it.
Where my stockists are
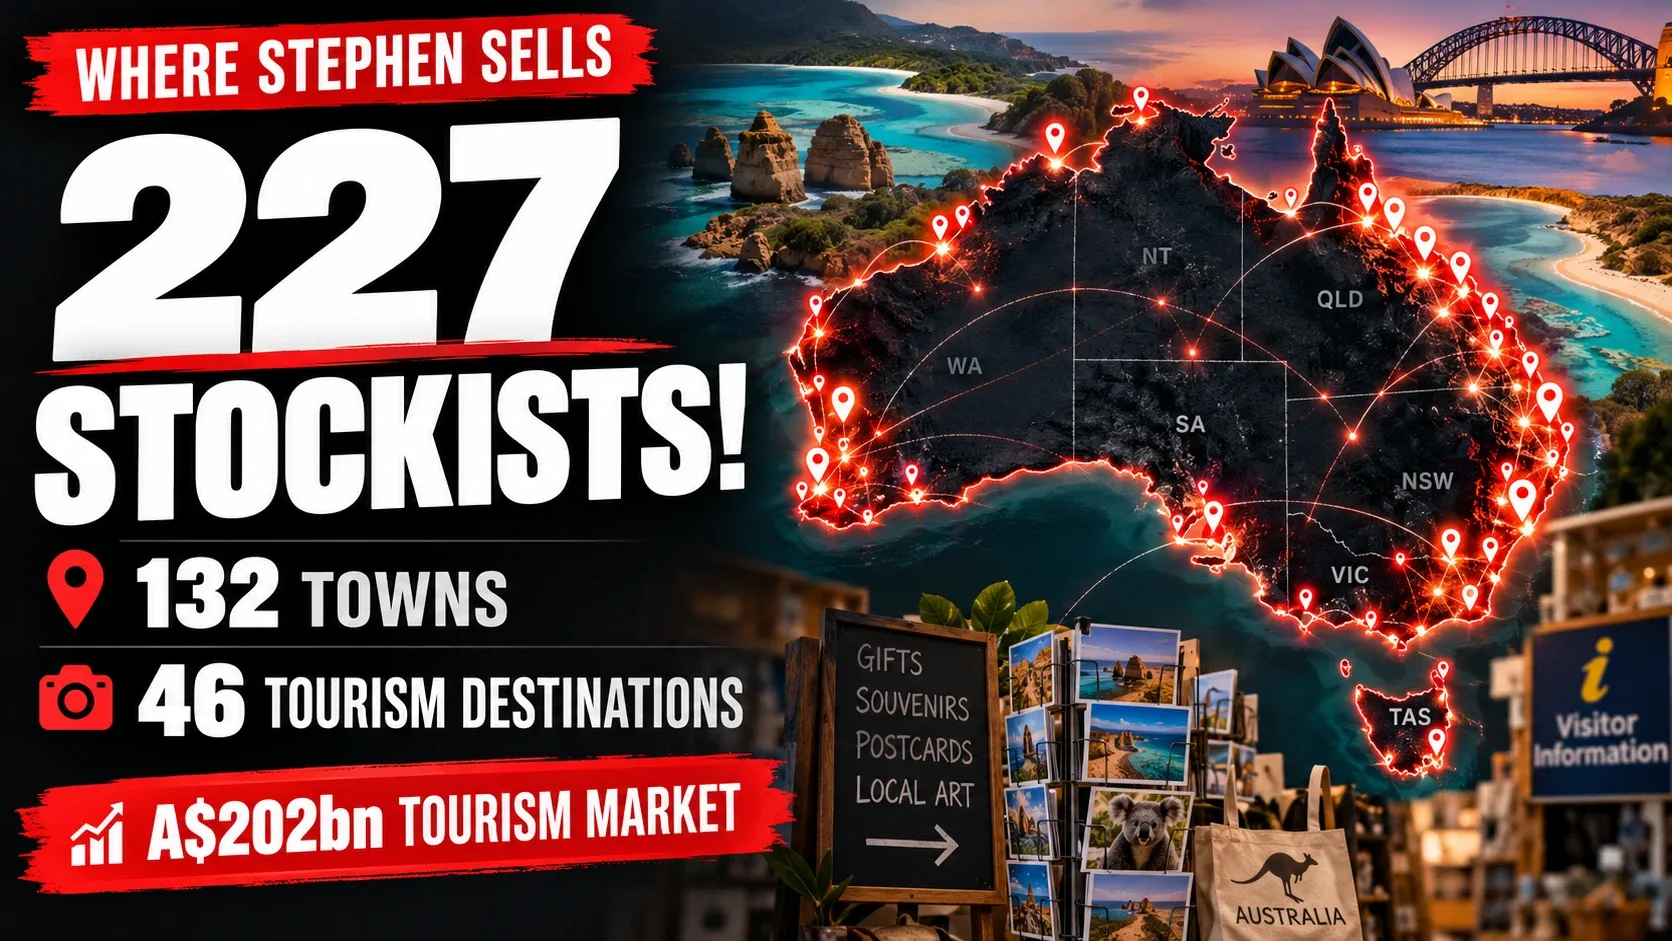
I supply 227 stockists across 132 towns and suburbs. Group them by place and they cover 46 tourism destinations and 30 official Tourism Research Australia regions, across six states and territories.
None of that is an accident. My stores are where the holiday-makers are: the Gold Coast, the Sunshine Coast, Cairns, the Whitsundays, the Mornington Peninsula, the Great Ocean Road, the Northern Rivers, Port Stephens, the Coffs Coast, the Sapphire Coast, the Coral Coast and up into the Kimberley. If you want to see every town, it’s all on the map.
So how big is that market?
| Measure | Figure |
|---|---|
| Tourism spending in the six states and territories I cover (2024–25) | A$202 billion, about 96% of Australia’s A$211.1bn |
| What visitors spend on shopping, gifts and souvenirs, nationally (2024–25) | A$20.8 billion |
| Visitor trips a year to the 46 destinations my stores are in (estimate) | More than 120 million |
| Souvenir-buying visits a year in those destinations (base-case estimate) | About 22.6 million |
The first two are official numbers. The A$202 billion comes from Tourism Research Australia, and the A$20.8 billion from the Australian Bureau of Statistics. To be fair, that second one covers more than souvenirs. It includes clothing, books and everything else visitors buy in shops. But it tells you visitors spend serious money at the counter.
The last two are our own estimates, and I want to be upfront about that. We added up overnight trips, day trips and international visits for each destination, then applied a realistic souvenir-buying rate. They count trips, not people, and they show the size of the market, not my sales. I’ve set out exactly how we worked them out further down.
How likely is a visitor to actually buy something?
There’s no single national figure for this in Australia, so we went with the best evidence we could find:
- Australian travellers: shopping was a leisure activity on 18% of domestic overnight trips (15% on regional trips, 22% in the capitals). In my experience a lot of souvenir buying isn’t planned at all. It’s the magnet or keyring picked up at the counter on the way out, so I’d expect the real rate to be higher.
- Overseas visitors: one in three travellers surveyed by Tourism Australia said they were specifically interested in souvenir shopping. For luxury and working-holiday travellers it’s around 40%.
- People on the road: Australians took 17.3 million caravan and camping trips in 2025, and 87% of those nights were spent in regional areas. Those travellers stop at visitor centres, roadhouses and attractions, which is exactly the kind of business on my run.
So the model works on roughly one in four regional overnight visitors buying a souvenir, three in ten city visitors, one in eight day-trippers and four in ten international holiday-makers.
How the estimates were made
The two official figures (A$202 billion and A$20.8 billion) are published 2024–25 data. The visitor-trip and souvenir-buying numbers are our estimates, and here’s how we got them, so you can judge them for yourself.
Visitor trips (about 120 million a year). For each of the 46 destinations we used the best official or destination-body visitor statistics available, mostly for 2024, and added up three kinds of trip:
| Trip type | Trips a year (46 destinations) |
|---|---|
| Domestic overnight trips | about 48.2 million |
| Domestic day trips | about 67.7 million |
| International overnight visitors | about 4.3 million |
| Total visitor-trip opportunities | about 120.3 million |
Where a destination didn’t have its own published figure, we shared out the broader regional data using a documented method. Each destination has a confidence grade: A for direct destination or region data (10 destinations), B for mostly direct data with one worked-out part (13), and C where a fair share is allocated or modelled (23).
Souvenir-buying visits (about 22.6 million, base case). We applied a buying rate to each type of trip and tested a low and a high case as well:
| Trip type | Low | Base | High | Based on |
|---|---|---|---|---|
| Domestic overnight, regional | 15% | 25% | 35% | 15% of regional overnight trips included leisure shopping (TRA) |
| Domestic overnight, city | 22% | 30% | 40% | 22% of capital-city overnight trips included leisure shopping (TRA) |
| Domestic day trip | 8% | 12% | 18% | No clean measure, so kept deliberately conservative |
| International leisure | 33% | 40% | 50% | 33% of travellers interested in souvenir shopping (Tourism Australia) |
That gives a range of about 15.1 million to 31.9 million souvenir-buying visits a year, with 22.6 million as the middle case.
What the words mean
- Stockist: a store in my client records with a known town (227, October 2026). It’s a count of stores I’ve supplied, not a sales figure.
- Tourism destination: a holiday area like the Sapphire Coast or the Whitsundays (46 of them).
- Official tourism region: a Tourism Research Australia region with at least one of my stockists in it (30).
- Trip: one visit to a destination. One person can make several trips, or pass through several places on one trip, so trips are not the same as people.
The limits. Tourism Research Australia changed how it surveys domestic travel in January 2025, so we haven’t mixed the old and new figures. The buying rates are planning assumptions based on published research, not measured purchases. And none of these numbers are my sales.
The biggest crowds aren’t always the best places to sell
By sheer visitor numbers, Brisbane, the Gold Coast, the Sunshine Coast, the Mornington Peninsula and Victoria’s High Country come out on top. But a big city’s visitors are spread across a huge economy. Places like the Whitsundays, Port Stephens or the Sapphire Coast get fewer people, but they have a strong holiday feel and more of their shops are set up for visitors. That’s where a product with the town or region on it really earns its place on the shelf.
Overseas visitors matter too. Cairns, the Gold Coast, the Whitsundays, Port Douglas and the Kimberley all draw international travellers, and they’re some of the keenest souvenir buyers there are.
What it means for your range
An agent is only as good as the stores they walk into. Mine are gift shops, newsagencies, pharmacies, visitor centres, attractions and specialty stores in the places I’ve listed above: the places people stop, have a look around and buy something to remember the trip.
If your products are made for that market, have a look at how representation works, or just get in touch and tell me about your range.
If you run a store in one of these places
Those visitors are walking past your counter. If you run a gift shop, newsagency, pharmacy, visitor centre or attraction shop, I can help you put together a range that suits them, whatever the size of your store. Book a visit, ask for range advice or see the products I can bring you.
About these figures: tourism spending and the visitor-retail category are official 2024–25 data. Visitor-trip and souvenir-buying figures are estimates prepared for Rose Agencies (October 2026) from state and regional tourism body visitor data and published research on tourism shopping. Stockist counts come from Rose Agencies’ client records; store names are kept private.
Sources
- Tourism Research Australia: State and Regional Tourism Satellite Account 2024–25
- Tourism Research Australia: National Tourism Satellite Account
- ABS: Australian National Accounts, Tourism Satellite Account 2024–25
- Tourism Research Australia: Domestic visitor profiles, shopping for leisure
- Tourism Australia: Future of Demand experience fact sheets
- Tourism Research Australia: Caravan and camping data